- L-Plate Retiree
- Posts
- The CAPE Ratio Just Hit 40. What History Says Happens Next.
The CAPE Ratio Just Hit 40. What History Says Happens Next.
The S&P 500 hasn't been this expensive since 1999. Here's what history says typically happens next – and why it might be different this time.
Sponsored by

because retirement doesn’t come with a manual
Should you run for the door now? Well, know that missing the best market days drastically reduce your returns. If your horizon is long enough, always stay invested and ride the volatility out.
CS

Records again – barely. Iran submitted a new Hormuz proposal. The biggest earnings week of the year begins.
The quick scan: Monday delivered another pair of all-time closing records for the S&P 500 and NASDAQ, though gains were modest as the Iran diplomatic picture remained murky. Trump cancelled the Islamabad talks over the weekend, saying Iran should "call him" when ready. Then, through Pakistani mediators, Iran submitted a new proposal to reopen the Strait and end the war – with nuclear negotiations deferred to a later stage. Markets processed all of this and moved fractionally higher. The real story this week is earnings: Microsoft, Alphabet, Amazon, Meta and Apple all report, alongside a Fed decision on Wednesday.
S&P 500: +0.12% to 7,173.91 – a new all-time record close, though the gain of just 0.12% reflects the market's ambivalence about the Iran situation; the index has now closed at a record for the sixth time in seven sessions
Dow Jones: -0.13% to 49,167.79 – fell 62.92 points; the Dow's mild underperformance reflects its higher weighting toward industrials and energy names sensitive to oil price moves
NASDAQ: +0.20% to 24,887.10 – a new all-time record close; Qualcomm surged 10% on reports it is developing smartphone processors with OpenAI and MediaTek; TSMC rose 2.30% to a record high after Taiwan's regulator moved to ease fund concentration limits; Verizon added 3.50% after raising its full-year earnings outlook.
What's driving it: The week's dominant theme is the collision of geopolitical uncertainty and the most consequential earnings week of the year. Iran's new Hormuz proposal via Pakistani mediators is the latest back-and-forth – markets are treating it with cautious optimism. Oil edged higher on residual Strait uncertainty. Asia provided a positive backdrop: Japan's Nikkei hit a record 60,537.36, South Korea's Kospi scaled a new peak. The Fed holds Wednesday, but Kevin Warsh's imminent confirmation as chair adds an unusual monetary policy uncertainty to the week.
Bottom line: Six records in seven sessions, a CAPE of 40.1, an unresolved war, and five of the world's most valuable companies reporting this week. That's a reason to pay attention. Today's article on the CAPE ratio is worth reading before the Magnificent Five results arrive.
Stop Losing Your Money. It's time to upgrade your trading platform.

Your current trading platform is probably letting you down
Limited assets (no international stocks, no commodities, no pre-IPO companies)
Limited ability to short
Limited access to leverage
Limited trading hours
Liquid is one of the fastest growing trading platforms, allowing users to trade stocks, commodities, FX, and more 24/7/365 from their phone and computer.
Trading on Liquid is as simple as:
Pick an asset
Pick long or short
Pick your position size and leverage
Place your trade
The best part is that Liquid markets never close. So no matter what is going on in the world, you are able to keep your portfolio positioned properly.

Is the Market Too Expensive? The Number That Should Make You Pause.
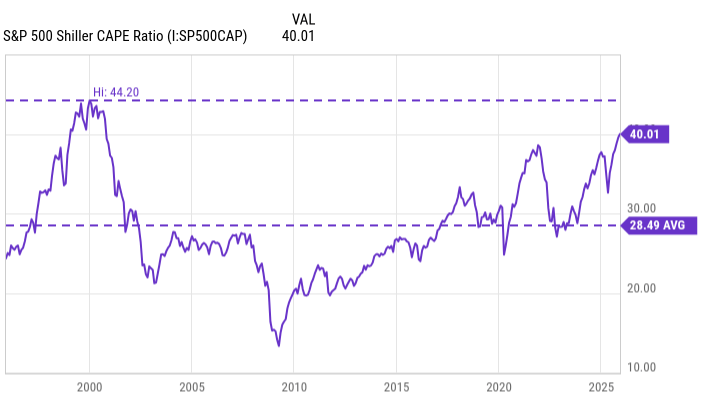
looks like an ECG - but this is the CAPE ratio
The scoop: Last week, the S&P 500 closed at new all-time records multiple times. The NASDAQ hit fresh highs. The semiconductor index gained for 18 consecutive sessions. Intel surged to a 26-year peak. Nvidia retook $5 trillion.
And quietly, in the background, a valuation metric that professional investors watch closely crossed a threshold it hasn't crossed since 1999.
The Shiller CAPE ratio – the Cyclically Adjusted Price-to-Earnings ratio, developed by Yale economist Robert Shiller – just reached 40.1. The last time this measure was this elevated was during the dot-com bubble.
This doesn't mean the market is about to crash. It doesn't mean you should sell. But it's a number worth understanding, because the historical record of what happens after a CAPE of 40+ is not particularly comforting – and the bullish counter-argument, while real, rests on assumptions that deserve scrutiny.
What the CAPE ratio actually measures.
The standard P/E ratio – price divided by the last year's earnings – is volatile. One good or bad year can distort it badly. The CAPE ratio divides the current price by the average of the past ten years of earnings, adjusted for inflation, giving a more reliable picture of whether markets are cheap or expensive.
A CAPE of 25 or above is generally considered elevated. A CAPE above 30 is rare. A CAPE of 40.1 has, in modern market history, occurred essentially once before: in 1999, at the height of the dot-com boom.
What history says about what comes next.
The Motley Fool, citing research conducted by Invesco, outlines the relationship between starting CAPE ratios and forward returns. The conclusion is direct: when the CAPE ratio is at this level, the S&P 500's annualised gains over the following ten years can be negative.
The CAPE is not useful for timing the market month to month – it can stay elevated for years before reverting. What it measures is the expected return an investor who buys today can reasonably expect over the next decade. At a CAPE of 40.1, those expectations are historically low to negative.
The historical record on this is sobering. The S&P 500 delivered extraordinary returns through the late 1990s – five consecutive years of 20%+ gains from 1995 to 1999. The streak ended with a 9.1% loss in 2000, the start of a bear market that erased roughly half the market's value before bottoming in 2002.
We have just completed something similar. Between 2023 and 2025, the S&P 500 and NASDAQ averaged annual gains of 21% and 30% respectively. Three consecutive years of exceptional performance that would, under historical patterns, warrant caution.
The bullish case – and it is real.
The core bullish case is that AI earnings are real in a way dot-com earnings were not. In 1999, the internet boom was built on companies with no sustainable business models, no earnings, and valuations detached from any conceivable future cash flow. What has driven the current market – the semiconductor and AI infrastructure buildout – is underpinned by tangible results. Intel's recent earnings confirmed that AI capital expenditure is delivering real returns. Nvidia's revenue has grown nearly fivefold in two years. Microsoft, Amazon, Alphabet and Meta are investing hundreds of billions in AI infrastructure and seeing measurable returns.
There is also the 20-year argument. Over every rolling 20-year period in its history, the S&P 500 has delivered positive total returns. The CAPE ratio can predict a difficult decade. It has never predicted a difficult two decades.
What to do with this information.
The honest answer is: probably less than you think.
The CAPE ratio at 40+ does not tell you the market will fall tomorrow, next month, or even next year. Investors who sold in 1997 – when the CAPE was already elevated – missed three more years of extraordinary gains before the crash. If you have been experiencing 20%+ annual returns and are projecting that forward, the CAPE at 40.1 is a useful corrective: expected returns over the next decade are materially lower than the long-run average of 10.5% per year.
For retirees, this matters in three specific ways.
First, sequence of returns risk. If you are drawing down your portfolio now, a period of flat or negative returns in the early years does the most damage. The CAPE modestly raises that probability. Ensure your cash buffer can fund 2–3 years of withdrawals without forced equity selling.
Second, asset allocation. International markets – Europe, Japan, parts of Asia – are trading at substantially lower CAPE ratios than the US, suggesting better long-run expected returns from a globally diversified portfolio.
Third, bonds and cash. With short-term rates still elevated, cash and short-duration bonds are offering real income. A portfolio holding some of this reduces sequence-of-returns exposure without requiring market timing.
The one thing nobody knows.
The article's fundamental honesty is its acknowledgement that historical precedents are murky at best. The CAPE predicted, broadly correctly, that returns following 1999 would be poor. But it also stayed elevated throughout a period when the correct investment decision was to remain invested, not flee.
The market has just done something it hasn't done since 1999. Whether that is the beginning of a cautionary tale or just another data point in an AI-driven bull market that has more room to run – nobody knows with certainty.
What you can do is make sure your portfolio is built for a range of outcomes, not just the optimistic one.
Actionable takeaways for L-Plate Retirees:
Understand what the CAPE ratio is telling you – and what it isn't. A CAPE of 40.1 does not predict a crash. It signals that expected returns over the next decade are historically low when starting from this valuation.
Recalibrate your return expectations. If your retirement plan assumes 8–10% annual equity returns, a CAPE of 40 suggests those assumptions may be optimistic for the next decade. Build a version of your plan that works on 4–6% returns and see how it looks.
Sequence of returns risk is the CAPE's most direct message for retirees. If you are drawing down your portfolio now, a period of subdued early returns does the most damage. Ensure your cash buffer and bond allocation can fund 2–3 years of withdrawals without forced equity selling.
Consider international diversification. European, Japanese and Asian equity markets are trading at substantially lower CAPE ratios than the US. A globally diversified equity portfolio has historically delivered better risk-adjusted returns than a US-concentrated one at peak US valuations.
Don't sell everything – that's market timing, and it doesn't work. The investors who exited US equities in 1997 missed three more years of gains before the crash. Staying invested with a sensible allocation has historically outperformed market timing.
The bullish case deserves honest engagement, not dismissal. The AI earnings underlying this market are real in a way dot-com earnings were not. Sustained earnings growth can justify elevated valuations – and Q1 2026 earnings are tracking at 16.1% growth. The CAPE is a warning, not a verdict.
Your Turn:
Had you heard of the Shiller CAPE ratio before today, and if so, does seeing it at 40.1 change anything about how you're thinking about your portfolio right now?
The distinction between "the market is expensive" and "you should sell" is one that many investors struggle to hold simultaneously. Where do you currently sit on that – are you finding it hard to stay invested at these levels, or are you comfortable holding through?
The bullish case rests substantially on the idea that AI earnings are real and sustainable, unlike the dot-com era. Do you find that argument convincing – or does the chart showing a CAPE last seen in 1999 override it for you?
👉 Hit reply and share your thoughts – your answers could inspire fellow readers in future issues.
If today's issue gave you something useful to think about, consider supporting L-Plate Retiree on Ko-fi.
Resources:
The Next Level Options (NLOMBA) course is a solid, all-in-one roadmap for mastering options investing. You’ll learn what options really are, how to invest in different market conditions, and how to pick strong companies using Buffett-inspired fundamentals.
Inside, the lessons walk you step-by-step through strategies like BOSS and Strategy X, so you’re not guessing – you’re following a proven structure that helps you invest with clarity and confidence.
What to see everything that’s included?
👉 Check out the Options Workshop
Prepare before the IPO volatility begins.

Most retail investors will hear about the SpaceX IPO after it's too late. Discover the positioning strategies serious investors evaluate before volatility begins and the early signals Wall Street is watching right now.
If these insights resonate with you, you’re in the right place. The L-Plate Retiree community is just beginning, and we’re figuring this out together-no pretence, no judgment, just honest conversation about navigating this next chapter.
Subscribe now to receive daily insights, practical tips, and the occasional laugh to help you thrive in retirement. We speak human here-no jargon without explanation, no assuming you’ve been investing since kindergarten.
And if today’s investing note hit the spot, you can buy us a coffee on Ko-fi ☕. Consider it your safest trade of the week-low risk, high return (in good vibes).
Because retirement doesn’t come with a manual… but now it does come with this newsletter.
The L-Plate Retiree Team
(Disclaimer: While we love a good laugh, the information in this newsletter is for general informational and entertainment purposes only, and does not constitute financial, health, or any other professional advice. Always consult with a qualified professional before making any decisions about your retirement, finances, or health.)
Reply